
 - Blog
| Conference: | ASun |
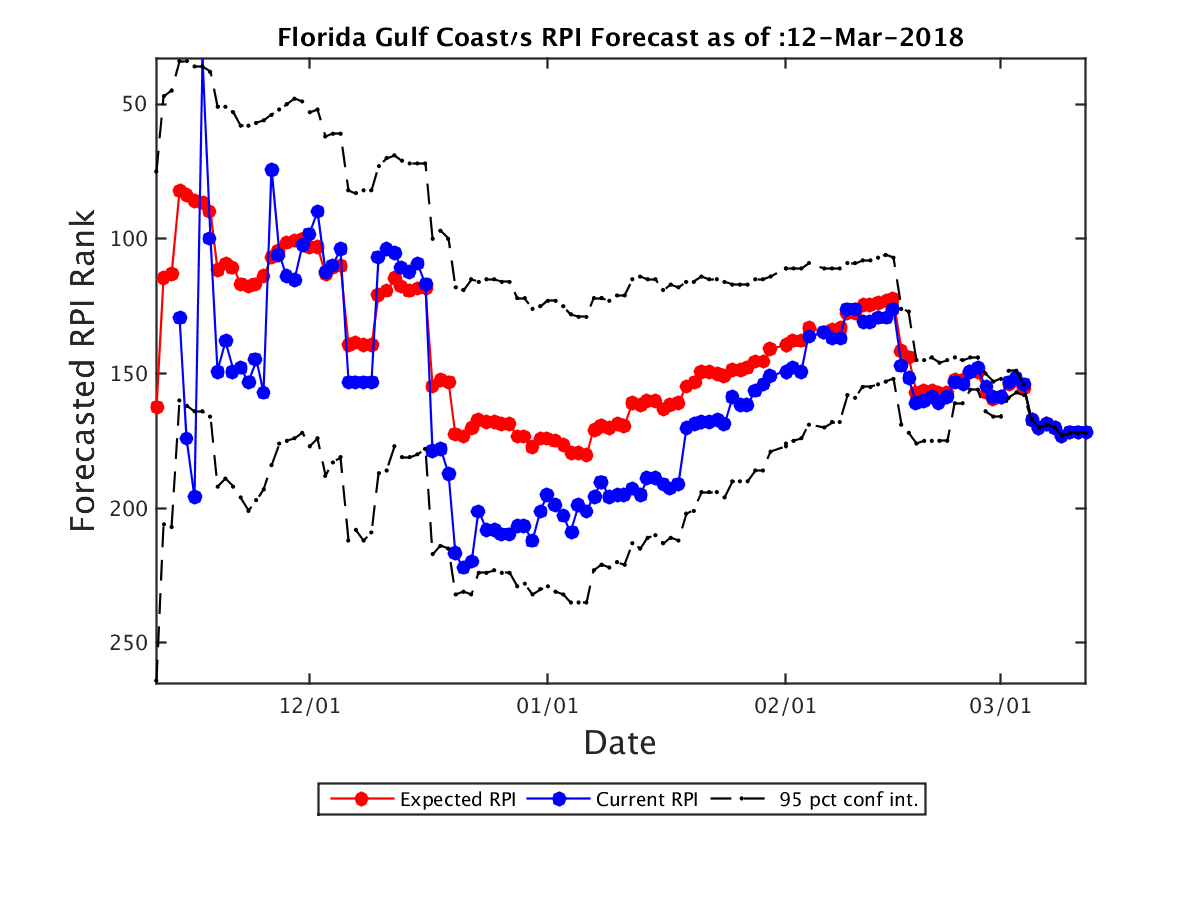
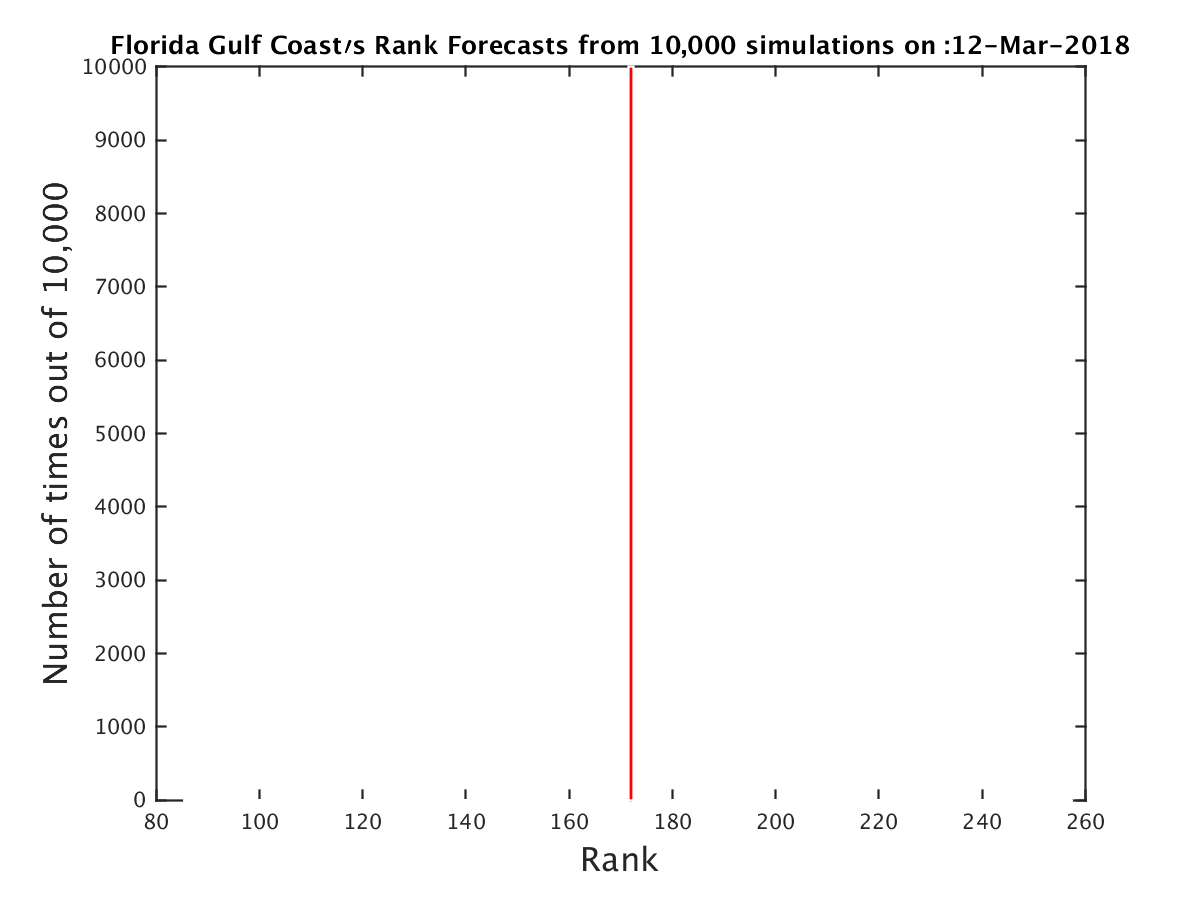
| Expected RPI: | 172.0 |
| Current RPI: | 172 |
| Expected SOS: | 277 |
| Current SOS: | 277 |
| Current Record: | 20-11 |
| Expected Record: | 20-11 |
| Current Conf Record: | 14-3 |
| Expected Conf Record: | 14-3 |
| Expected Record vs RPI 1-25: | 0-2 |
| Expected Record vs RPI 26-50: | 0-2 |
| Expected Record vs RPI 51-100: | 1-0 |
| Expected Record vs RPI 101-200: | 3-3 |
| Expected Record vs RPI 200+: | 16-4 |
| Current OOC Record: | 6-8 |
| Expected OOC Record: | 6-8 |
| Expected OOC RPI: | 178 |
| Expected OOC SOS: | 114 |
| Final Record | Expected RPI | Probability |
|---|---|---|
| 20-11 | 172.0 | 100.00% |
| Date | Opponent (Expected RPI) | Conf | Location | Score | Outcome | Prob(W) | Spread |
|---|---|---|---|---|---|---|---|
| 11-11 | Illinois St. (85.0) | MVC | H | 98-87 | W | 100% | 0.0 |
| 11-13 | Siena (299.0) | MAAC | A | 53-86 | W | 100% | 0.0 |
| 11-18 | Bowling Green (193.0) | MAC | A | 83-80 | L | 0% | 0.0 |
| 11-21 | Middle Tennessee (33.0) | CUSA | A | 85-72 | L | 0% | 0.0 |
| 11-24 | Denver (224.0) | Sum | H | 79-71 | W | 100% | 0.0 |
| 11-25 | Navy (200.0) | Pat | H | 70-54 | W | 100% | 0.0 |
| 11-26 | St. Francis NY (276.0) | NEC | H | 75-51 | W | 100% | 0.0 |
| 12-2 | Middle Tennessee (33.0) | CUSA | H | 76-81 | L | 0% | 0.0 |
| 12-5 | Florida Atlantic (275.0) | CUSA | H | 88-92 | L | 0% | 0.0 |
| 12-9 | UT Arlington (108.0) | SB | A | 78-85 | W | 100% | 0.0 |
| 12-16 | Oral Roberts (255.0) | Sum | H | 64-83 | L | 0% | 0.0 |
| 12-19 | FIU (295.0) | CUSA | A | 91-88 | L | 0% | 0.0 |
| 12-22 | Wichita St. (16.0) | Amer | A | 75-65 | L | 0% | 0.0 |
| 12-27 | Rhode Island (19.0) | A10 | A | 80-60 | L | 0% | 0.0 |
| 1-6 | Stetson (325.0) | ASun | H | 90-52 | W | 100% | 0.0 |
| 1-11 | USC Upstate (344.0) | ASun | H | 75-58 | W | 100% | 0.0 |
| 1-13 | NJIT (269.0) | ASun | H | 68-54 | W | 100% | 0.0 |
| 1-18 | Lipscomb (101.0) | ASun | A | 83-88 | W | 100% | 0.0 |
| 1-20 | Kennesaw St. (301.0) | ASun | A | 49-66 | W | 100% | 0.0 |
| 1-24 | North Florida (218.0) | ASun | A | 87-96 | W | 100% | 0.0 |
| 1-27 | Jacksonville (286.0) | ASun | H | 68-62 | W | 100% | 0.0 |
| 1-29 | North Florida (218.0) | ASun | H | 103-70 | W | 100% | 0.0 |
| 2-3 | Jacksonville (286.0) | ASun | A | 55-80 | W | 100% | 0.0 |
| 2-8 | NJIT (269.0) | ASun | A | 70-75 | W | 100% | 0.0 |
| 2-10 | USC Upstate (344.0) | ASun | A | 71-88 | W | 100% | 0.0 |
| 2-15 | Kennesaw St. (301.0) | ASun | H | 93-97 | L | 0% | 0.0 |
| 2-17 | Lipscomb (101.0) | ASun | H | 87-90 | L | 0% | 0.0 |
| 2-22 | Stetson (325.0) | ASun | A | 60-76 | W | 100% | 0.0 |
| 2-26 | USC Upstate (344.0) | ASun | H | 96-76 | W | 100% | 0.0 |
| 3-1 | North Florida (218.0) | ASun | H | 95-72 | W | 100% | 0.0 |
| 3-4 | Lipscomb (101.0) | ASun | H | 96-108 | L | 0% | 0.0 |
| Team | Conf | Curr Wgt | Fut Wgt | Curr W/L | Exp W/L | Curr Impact | Exp Impact |
|---|---|---|---|---|---|---|---|
| Florida Gulf Coast | ASun | 26.64 | 26.64 | 62.75 | 62.75 | 6.79 | 6.79 |
| Lipscomb | ASun | 5.77 | 5.77 | 69.23 | 69.23 | 2.22 | 2.22 |
| North Florida | ASun | 5.72 | 5.72 | 40.74 | 40.74 | -1.06 | -1.06 |
| USC Upstate | ASun | 5.68 | 5.68 | 12.00 | 12.00 | -4.32 | -4.32 |
| Jacksonville | ASun | 4.21 | 4.21 | 40.74 | 40.74 | -0.78 | -0.78 |
| Stetson | ASun | 4.18 | 4.18 | 30.77 | 30.77 | -1.61 | -1.61 |
| NJIT | ASun | 4.15 | 4.15 | 46.15 | 46.15 | -0.32 | -0.32 |
| Kennesaw St. | ASun | 4.12 | 4.12 | 26.92 | 26.92 | -1.90 | -1.90 |
| Middle Tennessee | CUSA | 3.28 | 3.28 | 75.00 | 75.00 | 1.64 | 1.64 |
| FIU | CUSA | 1.86 | 1.86 | 35.71 | 35.71 | -0.53 | -0.53 |
| Denver | Sum | 1.84 | 1.84 | 48.15 | 48.15 | -0.07 | -0.07 |
| Navy | Pat | 1.75 | 1.75 | 63.33 | 63.33 | 0.47 | 0.47 |
| Florida Atlantic | CUSA | 1.72 | 1.72 | 29.63 | 29.63 | -0.70 | -0.70 |
| Bowling Green | MAC | 1.70 | 1.70 | 44.83 | 44.83 | -0.18 | -0.18 |
| Oral Roberts | Sum | 1.70 | 1.70 | 25.93 | 25.93 | -0.82 | -0.82 |
| St. Francis NY | NEC | 1.67 | 1.67 | 39.29 | 39.29 | -0.36 | -0.36 |
| Illinois St. | MVC | 1.61 | 1.61 | 54.84 | 54.84 | 0.16 | 0.16 |
| Rhode Island | A10 | 1.61 | 1.61 | 77.42 | 77.42 | 0.88 | 0.88 |
| Siena | MAAC | 1.61 | 1.61 | 25.81 | 25.81 | -0.78 | -0.78 |
| UT Arlington | SB | 1.61 | 1.61 | 62.50 | 62.50 | 0.40 | 0.40 |
| Wichita St. | Amer | 1.61 | 1.61 | 77.42 | 77.42 | 0.88 | 0.88 |
| Abilene Christian | Slnd | 0.28 | 0.28 | 44.44 | 44.44 | -0.03 | -0.03 |
| UAB | CUSA | 0.25 | 0.25 | 58.06 | 58.06 | 0.04 | 0.04 |
| Southern Miss | CUSA | 0.25 | 0.25 | 40.00 | 40.00 | -0.05 | -0.05 |
| Belmont | OVC | 0.22 | 0.22 | 72.73 | 72.73 | 0.10 | 0.10 |
| Bethune Cookman | MEAC | 0.20 | 0.20 | 53.33 | 53.33 | 0.01 | 0.01 |
| Tennessee St. | OVC | 0.19 | 0.19 | 46.43 | 46.43 | -0.01 | -0.01 |
| Old Dominion | CUSA | 0.19 | 0.19 | 78.12 | 78.12 | 0.11 | 0.11 |
| North Texas | CUSA | 0.19 | 0.19 | 43.33 | 43.33 | -0.03 | -0.03 |
| Rice | CUSA | 0.19 | 0.19 | 17.24 | 17.24 | -0.13 | -0.13 |
| Fort Wayne | Sum | 0.17 | 0.17 | 50.00 | 50.00 | 0.00 | 0.00 |
| North Dakota St. | Sum | 0.17 | 0.17 | 41.38 | 41.38 | -0.03 | -0.03 |
| Campbell | BSth | 0.17 | 0.17 | 46.43 | 46.43 | -0.01 | -0.01 |
| South Dakota | Sum | 0.17 | 0.17 | 73.33 | 73.33 | 0.08 | 0.08 |
| Charlotte | CUSA | 0.17 | 0.17 | 17.86 | 17.86 | -0.11 | -0.11 |
| Louisiana Tech | CUSA | 0.16 | 0.16 | 48.39 | 48.39 | -0.01 | -0.01 |
| Marshall | CUSA | 0.16 | 0.16 | 69.70 | 69.70 | 0.06 | 0.06 |
| Western Kentucky | CUSA | 0.16 | 0.16 | 69.70 | 69.70 | 0.06 | 0.06 |
| Miami FL | ACC | 0.16 | 0.16 | 70.97 | 70.97 | 0.07 | 0.07 |
| Minnesota | B10 | 0.14 | 0.14 | 46.88 | 46.88 | -0.01 | -0.01 |
| Gardner Webb | BSth | 0.14 | 0.14 | 37.93 | 37.93 | -0.03 | -0.03 |
| LIU Brooklyn | NEC | 0.14 | 0.14 | 51.52 | 51.52 | 0.00 | 0.00 |
| Tennessee Tech | OVC | 0.14 | 0.14 | 54.84 | 54.84 | 0.01 | 0.01 |
| South Dakota St. | Sum | 0.14 | 0.14 | 80.00 | 80.00 | 0.08 | 0.08 |
| South Florida | Amer | 0.14 | 0.14 | 31.25 | 31.25 | -0.05 | -0.05 |
| Michigan | B10 | 0.14 | 0.14 | 79.41 | 79.41 | 0.08 | 0.08 |
| Mount St. Mary's | NEC | 0.14 | 0.14 | 53.33 | 53.33 | 0.01 | 0.01 |
| Eastern Michigan | MAC | 0.13 | 0.13 | 58.62 | 58.62 | 0.02 | 0.02 |
| Iona | MAAC | 0.13 | 0.13 | 60.61 | 60.61 | 0.03 | 0.03 |
| Alabama | SEC | 0.13 | 0.13 | 55.88 | 55.88 | 0.02 | 0.02 |
| VCU | A10 | 0.13 | 0.13 | 54.55 | 54.55 | 0.01 | 0.01 |
| Tulsa | Amer | 0.13 | 0.13 | 61.29 | 61.29 | 0.03 | 0.03 |
| Holy Cross | Pat | 0.13 | 0.13 | 38.71 | 38.71 | -0.03 | -0.03 |
| Kansas St. | B12 | 0.12 | 0.12 | 66.67 | 66.67 | 0.04 | 0.04 |
| Nebraska Omaha | Sum | 0.12 | 0.12 | 24.14 | 24.14 | -0.06 | -0.06 |
| Western Illinois | Sum | 0.12 | 0.12 | 33.33 | 33.33 | -0.04 | -0.04 |
| Fairleigh Dickinson | NEC | 0.11 | 0.11 | 37.93 | 37.93 | -0.03 | -0.03 |
| Wagner | NEC | 0.11 | 0.11 | 70.00 | 70.00 | 0.05 | 0.05 |
| Charleston Southern | BSth | 0.11 | 0.11 | 42.86 | 42.86 | -0.02 | -0.02 |
| UMKC | WAC | 0.11 | 0.11 | 27.59 | 27.59 | -0.05 | -0.05 |
| UNC Asheville | BSth | 0.11 | 0.11 | 61.29 | 61.29 | 0.03 | 0.03 |
| Buffalo | MAC | 0.11 | 0.11 | 75.76 | 75.76 | 0.06 | 0.06 |
| Creighton | BE | 0.11 | 0.11 | 64.52 | 64.52 | 0.03 | 0.03 |
| Brown | Ivy | 0.11 | 0.11 | 38.46 | 38.46 | -0.03 | -0.03 |
| Duquesne | A10 | 0.11 | 0.11 | 50.00 | 50.00 | 0.00 | 0.00 |
| UTEP | CUSA | 0.11 | 0.11 | 33.33 | 33.33 | -0.04 | -0.04 |
| UTSA | CUSA | 0.11 | 0.11 | 53.33 | 53.33 | 0.01 | 0.01 |
| South Alabama | SB | 0.11 | 0.11 | 40.00 | 40.00 | -0.02 | -0.02 |
| Colgate | Pat | 0.11 | 0.11 | 58.06 | 58.06 | 0.02 | 0.02 |
| Lafayette | Pat | 0.11 | 0.11 | 30.00 | 30.00 | -0.04 | -0.04 |
| Marist | MAAC | 0.11 | 0.11 | 19.35 | 19.35 | -0.07 | -0.07 |
| Missouri St. | MVC | 0.11 | 0.11 | 53.12 | 53.12 | 0.01 | 0.01 |
| UCF | Amer | 0.11 | 0.11 | 59.38 | 59.38 | 0.02 | 0.02 |
| Ball St. | MAC | 0.11 | 0.11 | 58.06 | 58.06 | 0.02 | 0.02 |
| Bryant | NEC | 0.11 | 0.11 | 9.68 | 9.68 | -0.09 | -0.09 |
| Georgia Southern | SB | 0.11 | 0.11 | 61.29 | 61.29 | 0.02 | 0.02 |
| Fairfield | MAAC | 0.11 | 0.11 | 51.52 | 51.52 | 0.00 | 0.00 |
| Georgia | SEC | 0.09 | 0.09 | 54.55 | 54.55 | 0.01 | 0.01 |
| Jacksonville St. | OVC | 0.09 | 0.09 | 62.50 | 62.50 | 0.02 | 0.02 |
| Texas Tech | B12 | 0.09 | 0.09 | 72.73 | 72.73 | 0.04 | 0.04 |
| Drexel | CAA | 0.08 | 0.08 | 37.50 | 37.50 | -0.02 | -0.02 |
| Green Bay | Horz | 0.08 | 0.08 | 33.33 | 33.33 | -0.03 | -0.03 |
| Milwaukee | Horz | 0.08 | 0.08 | 48.39 | 48.39 | -0.00 | -0.00 |
| Morehead St. | OVC | 0.08 | 0.08 | 22.22 | 22.22 | -0.05 | -0.05 |
| Purdue | B10 | 0.08 | 0.08 | 82.35 | 82.35 | 0.05 | 0.05 |
| Tennessee | SEC | 0.08 | 0.08 | 75.76 | 75.76 | 0.04 | 0.04 |
| Texas | B12 | 0.08 | 0.08 | 57.58 | 57.58 | 0.01 | 0.01 |
| Hofstra | CAA | 0.08 | 0.08 | 60.00 | 60.00 | 0.02 | 0.02 |
| Seton Hall | BE | 0.08 | 0.08 | 65.62 | 65.62 | 0.03 | 0.03 |
| Northern Illinois | MAC | 0.08 | 0.08 | 36.67 | 36.67 | -0.02 | -0.02 |
| Robert Morris | NEC | 0.08 | 0.08 | 48.48 | 48.48 | -0.00 | -0.00 |
| Florida | SEC | 0.08 | 0.08 | 62.50 | 62.50 | 0.02 | 0.02 |
| Florida A&M | MEAC | 0.08 | 0.08 | 24.24 | 24.24 | -0.04 | -0.04 |
| LSU | SEC | 0.08 | 0.08 | 54.84 | 54.84 | 0.01 | 0.01 |
| Michigan St. | B10 | 0.08 | 0.08 | 87.88 | 87.88 | 0.06 | 0.06 |
| Mississippi St. | SEC | 0.08 | 0.08 | 65.62 | 65.62 | 0.03 | 0.03 |
| Missouri | SEC | 0.08 | 0.08 | 61.29 | 61.29 | 0.02 | 0.02 |
| Wofford | SC | 0.08 | 0.08 | 60.00 | 60.00 | 0.02 | 0.02 |
| Army | Pat | 0.08 | 0.08 | 41.38 | 41.38 | -0.01 | -0.01 |
| Mississippi | SEC | 0.08 | 0.08 | 37.50 | 37.50 | -0.02 | -0.02 |
| Murray St. | OVC | 0.08 | 0.08 | 82.76 | 82.76 | 0.05 | 0.05 |
| Arkansas St. | SB | 0.08 | 0.08 | 30.00 | 30.00 | -0.03 | -0.03 |
| Manhattan | MAAC | 0.08 | 0.08 | 45.16 | 45.16 | -0.01 | -0.01 |
| Saint Peter's | MAAC | 0.08 | 0.08 | 43.75 | 43.75 | -0.01 | -0.01 |
| Evansville | MVC | 0.08 | 0.08 | 50.00 | 50.00 | 0.00 | 0.00 |
| Bucknell | Pat | 0.08 | 0.08 | 73.53 | 73.53 | 0.04 | 0.04 |
| Lehigh | Pat | 0.08 | 0.08 | 51.72 | 51.72 | 0.00 | 0.00 |
| College of Charleston | CAA | 0.08 | 0.08 | 77.42 | 77.42 | 0.04 | 0.04 |
| Davidson | A10 | 0.08 | 0.08 | 65.62 | 65.62 | 0.02 | 0.02 |
| Houston | Amer | 0.08 | 0.08 | 78.79 | 78.79 | 0.04 | 0.04 |
| Indiana St. | MVC | 0.08 | 0.08 | 37.93 | 37.93 | -0.02 | -0.02 |
| Loyola Chicago | MVC | 0.08 | 0.08 | 84.38 | 84.38 | 0.05 | 0.05 |
| Quinnipiac | MAAC | 0.08 | 0.08 | 36.36 | 36.36 | -0.02 | -0.02 |
| Southern Illinois | MVC | 0.08 | 0.08 | 59.38 | 59.38 | 0.01 | 0.01 |
| St. Bonaventure | A10 | 0.08 | 0.08 | 78.12 | 78.12 | 0.04 | 0.04 |
| Temple | Amer | 0.08 | 0.08 | 53.12 | 53.12 | 0.00 | 0.00 |
| Northern Iowa | MVC | 0.07 | 0.07 | 46.67 | 46.67 | -0.00 | -0.00 |
| Appalachian St. | SB | 0.07 | 0.07 | 41.94 | 41.94 | -0.01 | -0.01 |
| Georgia St. | SB | 0.07 | 0.07 | 68.75 | 68.75 | 0.03 | 0.03 |
| Louisiana Lafayette | SB | 0.07 | 0.07 | 80.65 | 80.65 | 0.04 | 0.04 |
| Butler | BE | 0.06 | 0.06 | 60.61 | 60.61 | 0.01 | 0.01 |
| Florida St. | ACC | 0.06 | 0.06 | 64.52 | 64.52 | 0.02 | 0.02 |
| Mercer | SC | 0.06 | 0.06 | 53.33 | 53.33 | 0.00 | 0.00 |
| Nebraska | B10 | 0.06 | 0.06 | 68.75 | 68.75 | 0.02 | 0.02 |
| Rutgers | B10 | 0.06 | 0.06 | 42.42 | 42.42 | -0.01 | -0.01 |
| Samford | SC | 0.06 | 0.06 | 26.67 | 26.67 | -0.03 | -0.03 |
| Seattle | WAC | 0.06 | 0.06 | 56.67 | 56.67 | 0.01 | 0.01 |
| SIU Edwardsville | OVC | 0.06 | 0.06 | 30.00 | 30.00 | -0.02 | -0.02 |
| UMass Lowell | AE | 0.06 | 0.06 | 37.93 | 37.93 | -0.01 | -0.01 |
| Washington | P12 | 0.06 | 0.06 | 62.50 | 62.50 | 0.01 | 0.01 |
| West Virginia | B12 | 0.06 | 0.06 | 70.59 | 70.59 | 0.02 | 0.02 |
| Yale | Ivy | 0.06 | 0.06 | 50.00 | 50.00 | 0.00 | 0.00 |
| San Jose St. | MWC | 0.06 | 0.06 | 10.34 | 10.34 | -0.04 | -0.04 |
| Central Connecticut | NEC | 0.06 | 0.06 | 43.75 | 43.75 | -0.01 | -0.01 |
| Eastern Kentucky | OVC | 0.06 | 0.06 | 31.03 | 31.03 | -0.02 | -0.02 |
| Georgetown | BE | 0.06 | 0.06 | 50.00 | 50.00 | 0.00 | 0.00 |
| North Carolina A&T | MEAC | 0.06 | 0.06 | 56.25 | 56.25 | 0.01 | 0.01 |
| North Carolina St. | ACC | 0.06 | 0.06 | 65.62 | 65.62 | 0.02 | 0.02 |
| Northern Arizona | BSky | 0.06 | 0.06 | 13.33 | 13.33 | -0.04 | -0.04 |
| Sacred Heart | NEC | 0.06 | 0.06 | 30.00 | 30.00 | -0.02 | -0.02 |
| South Carolina St. | MEAC | 0.06 | 0.06 | 26.67 | 26.67 | -0.03 | -0.03 |
| St. Francis PA | NEC | 0.06 | 0.06 | 57.14 | 57.14 | 0.01 | 0.01 |
| Wright St. | Horz | 0.06 | 0.06 | 71.88 | 71.88 | 0.02 | 0.02 |
| Oklahoma St. | B12 | 0.05 | 0.05 | 57.58 | 57.58 | 0.01 | 0.01 |
| Akron | MAC | 0.05 | 0.05 | 41.94 | 41.94 | -0.01 | -0.01 |
| Auburn | SEC | 0.05 | 0.05 | 78.12 | 78.12 | 0.03 | 0.03 |
| Central Michigan | MAC | 0.05 | 0.05 | 53.33 | 53.33 | 0.00 | 0.00 |
| Kent St. | MAC | 0.05 | 0.05 | 48.48 | 48.48 | -0.00 | -0.00 |
| Miami OH | MAC | 0.05 | 0.05 | 45.16 | 45.16 | -0.01 | -0.01 |
| Ohio | MAC | 0.05 | 0.05 | 43.33 | 43.33 | -0.01 | -0.01 |
| Princeton | Ivy | 0.05 | 0.05 | 42.86 | 42.86 | -0.01 | -0.01 |
| USC | P12 | 0.05 | 0.05 | 67.65 | 67.65 | 0.02 | 0.02 |
| Vanderbilt | SEC | 0.05 | 0.05 | 37.50 | 37.50 | -0.01 | -0.01 |
| Little Rock | SB | 0.05 | 0.05 | 20.00 | 20.00 | -0.03 | -0.03 |
| Fordham | A10 | 0.05 | 0.05 | 29.03 | 29.03 | -0.02 | -0.02 |
| Notre Dame | ACC | 0.05 | 0.05 | 57.58 | 57.58 | 0.01 | 0.01 |
| South Carolina | SEC | 0.05 | 0.05 | 50.00 | 50.00 | 0.00 | 0.00 |
| American | Pat | 0.05 | 0.05 | 20.00 | 20.00 | -0.03 | -0.03 |
| Boston University | Pat | 0.05 | 0.05 | 46.67 | 46.67 | -0.00 | -0.00 |
| Loyola MD | Pat | 0.05 | 0.05 | 26.67 | 26.67 | -0.02 | -0.02 |
| Bradley | MVC | 0.05 | 0.05 | 59.38 | 59.38 | 0.01 | 0.01 |
| Canisius | MAAC | 0.05 | 0.05 | 65.62 | 65.62 | 0.02 | 0.02 |
| Cincinnati | Amer | 0.05 | 0.05 | 88.24 | 88.24 | 0.04 | 0.04 |
| Connecticut | Amer | 0.05 | 0.05 | 43.75 | 43.75 | -0.01 | -0.01 |
| Dayton | A10 | 0.05 | 0.05 | 45.16 | 45.16 | -0.00 | -0.00 |
| Drake | MVC | 0.05 | 0.05 | 48.39 | 48.39 | -0.00 | -0.00 |
| La Salle | A10 | 0.05 | 0.05 | 40.62 | 40.62 | -0.01 | -0.01 |
| Massachusetts | A10 | 0.05 | 0.05 | 39.39 | 39.39 | -0.01 | -0.01 |
| Memphis | Amer | 0.05 | 0.05 | 61.76 | 61.76 | 0.01 | 0.01 |
| Monmouth | MAAC | 0.05 | 0.05 | 35.48 | 35.48 | -0.01 | -0.01 |
| Nevada | MWC | 0.05 | 0.05 | 79.41 | 79.41 | 0.03 | 0.03 |
| Saint Joseph's | A10 | 0.05 | 0.05 | 50.00 | 50.00 | 0.00 | 0.00 |
| SMU | Amer | 0.05 | 0.05 | 51.52 | 51.52 | 0.00 | 0.00 |
| Valparaiso | MVC | 0.05 | 0.05 | 43.33 | 43.33 | -0.01 | -0.01 |
| BYU | WCC | 0.05 | 0.05 | 70.59 | 70.59 | 0.02 | 0.02 |
| Niagara | MAAC | 0.05 | 0.05 | 59.38 | 59.38 | 0.01 | 0.01 |
| Coastal Carolina | SB | 0.05 | 0.05 | 37.93 | 37.93 | -0.01 | -0.01 |
| Louisiana Monroe | SB | 0.05 | 0.05 | 46.43 | 46.43 | -0.00 | -0.00 |
| Texas St. | SB | 0.05 | 0.05 | 41.94 | 41.94 | -0.01 | -0.01 |
| Air Force | MWC | 0.03 | 0.03 | 34.48 | 34.48 | -0.01 | -0.01 |
| Arkansas | SEC | 0.03 | 0.03 | 67.65 | 67.65 | 0.01 | 0.01 |
| Colorado | P12 | 0.03 | 0.03 | 53.12 | 53.12 | 0.00 | 0.00 |
| Montana | BSky | 0.03 | 0.03 | 77.42 | 77.42 | 0.02 | 0.02 |
| Montana St. | BSky | 0.03 | 0.03 | 36.67 | 36.67 | -0.01 | -0.01 |
| Northern Colorado | BSky | 0.03 | 0.03 | 61.29 | 61.29 | 0.01 | 0.01 |
| Oakland | Horz | 0.03 | 0.03 | 57.58 | 57.58 | 0.00 | 0.00 |
| Penn St. | B10 | 0.03 | 0.03 | 61.76 | 61.76 | 0.01 | 0.01 |
| Pepperdine | WCC | 0.03 | 0.03 | 16.13 | 16.13 | -0.02 | -0.02 |
| Stanford | P12 | 0.03 | 0.03 | 54.55 | 54.55 | 0.00 | 0.00 |
| Towson | CAA | 0.03 | 0.03 | 53.33 | 53.33 | 0.00 | 0.00 |
| UC Irvine | BW | 0.03 | 0.03 | 48.48 | 48.48 | -0.00 | -0.00 |
| UNLV | MWC | 0.03 | 0.03 | 60.61 | 60.61 | 0.01 | 0.01 |
| Wyoming | MWC | 0.03 | 0.03 | 59.38 | 59.38 | 0.01 | 0.01 |
| Elon | CAA | 0.03 | 0.03 | 40.00 | 40.00 | -0.01 | -0.01 |
| Hartford | AE | 0.03 | 0.03 | 58.06 | 58.06 | 0.00 | 0.00 |
| James Madison | CAA | 0.03 | 0.03 | 29.03 | 29.03 | -0.01 | -0.01 |
| Norfolk St. | MEAC | 0.03 | 0.03 | 43.33 | 43.33 | -0.00 | -0.00 |
| Toledo | MAC | 0.03 | 0.03 | 66.67 | 66.67 | 0.01 | 0.01 |
| Western Michigan | MAC | 0.03 | 0.03 | 50.00 | 50.00 | 0.00 | 0.00 |
| Columbia | Ivy | 0.03 | 0.03 | 26.92 | 26.92 | -0.01 | -0.01 |
| Coppin St. | MEAC | 0.03 | 0.03 | 15.62 | 15.62 | -0.02 | -0.02 |
| Delaware | CAA | 0.03 | 0.03 | 38.71 | 38.71 | -0.01 | -0.01 |
| Morgan St. | MEAC | 0.03 | 0.03 | 36.67 | 36.67 | -0.01 | -0.01 |
| Penn | Ivy | 0.03 | 0.03 | 74.19 | 74.19 | 0.01 | 0.01 |
| Pittsburgh | ACC | 0.03 | 0.03 | 25.00 | 25.00 | -0.01 | -0.01 |
| Albany | AE | 0.03 | 0.03 | 67.74 | 67.74 | 0.01 | 0.01 |
| Baylor | B12 | 0.03 | 0.03 | 54.84 | 54.84 | 0.00 | 0.00 |
| Boise St. | MWC | 0.03 | 0.03 | 73.33 | 73.33 | 0.01 | 0.01 |
| California | P12 | 0.03 | 0.03 | 25.81 | 25.81 | -0.01 | -0.01 |
| East Carolina | Amer | 0.03 | 0.03 | 33.33 | 33.33 | -0.01 | -0.01 |
| George Mason | A10 | 0.03 | 0.03 | 48.48 | 48.48 | -0.00 | -0.00 |
| George Washington | A10 | 0.03 | 0.03 | 45.45 | 45.45 | -0.00 | -0.00 |
| Illinois Chicago | Horz | 0.03 | 0.03 | 50.00 | 50.00 | 0.00 | 0.00 |
| Louisville | ACC | 0.03 | 0.03 | 60.61 | 60.61 | 0.01 | 0.01 |
| Marquette | BE | 0.03 | 0.03 | 59.38 | 59.38 | 0.00 | 0.00 |
| Oklahoma | B12 | 0.03 | 0.03 | 58.06 | 58.06 | 0.00 | 0.00 |
| Providence | BE | 0.03 | 0.03 | 61.76 | 61.76 | 0.01 | 0.01 |
| Richmond | A10 | 0.03 | 0.03 | 37.50 | 37.50 | -0.01 | -0.01 |
| Rider | MAAC | 0.03 | 0.03 | 70.97 | 70.97 | 0.01 | 0.01 |
| Saint Louis | A10 | 0.03 | 0.03 | 50.00 | 50.00 | 0.00 | 0.00 |
| Savannah St. | MEAC | 0.03 | 0.03 | 43.33 | 43.33 | -0.00 | -0.00 |
| Tulane | Amer | 0.03 | 0.03 | 45.16 | 45.16 | -0.00 | -0.00 |
| Vermont | AE | 0.03 | 0.03 | 78.79 | 78.79 | 0.01 | 0.01 |
| Virginia | ACC | 0.03 | 0.03 | 93.94 | 93.94 | 0.02 | 0.02 |
| Cal Poly | BW | 0.02 | 0.02 | 24.14 | 24.14 | -0.01 | -0.01 |
| Loyola Marymount | WCC | 0.02 | 0.02 | 33.33 | 33.33 | -0.01 | -0.01 |
| Troy | SB | 0.02 | 0.02 | 45.16 | 45.16 | -0.00 | -0.00 |
| UT Rio Grande Valley | WAC | 0.02 | 0.02 | 43.33 | 43.33 | -0.00 | -0.00 |
| Western Carolina | SC | 0.02 | 0.02 | 36.67 | 36.67 | -0.01 | -0.01 |